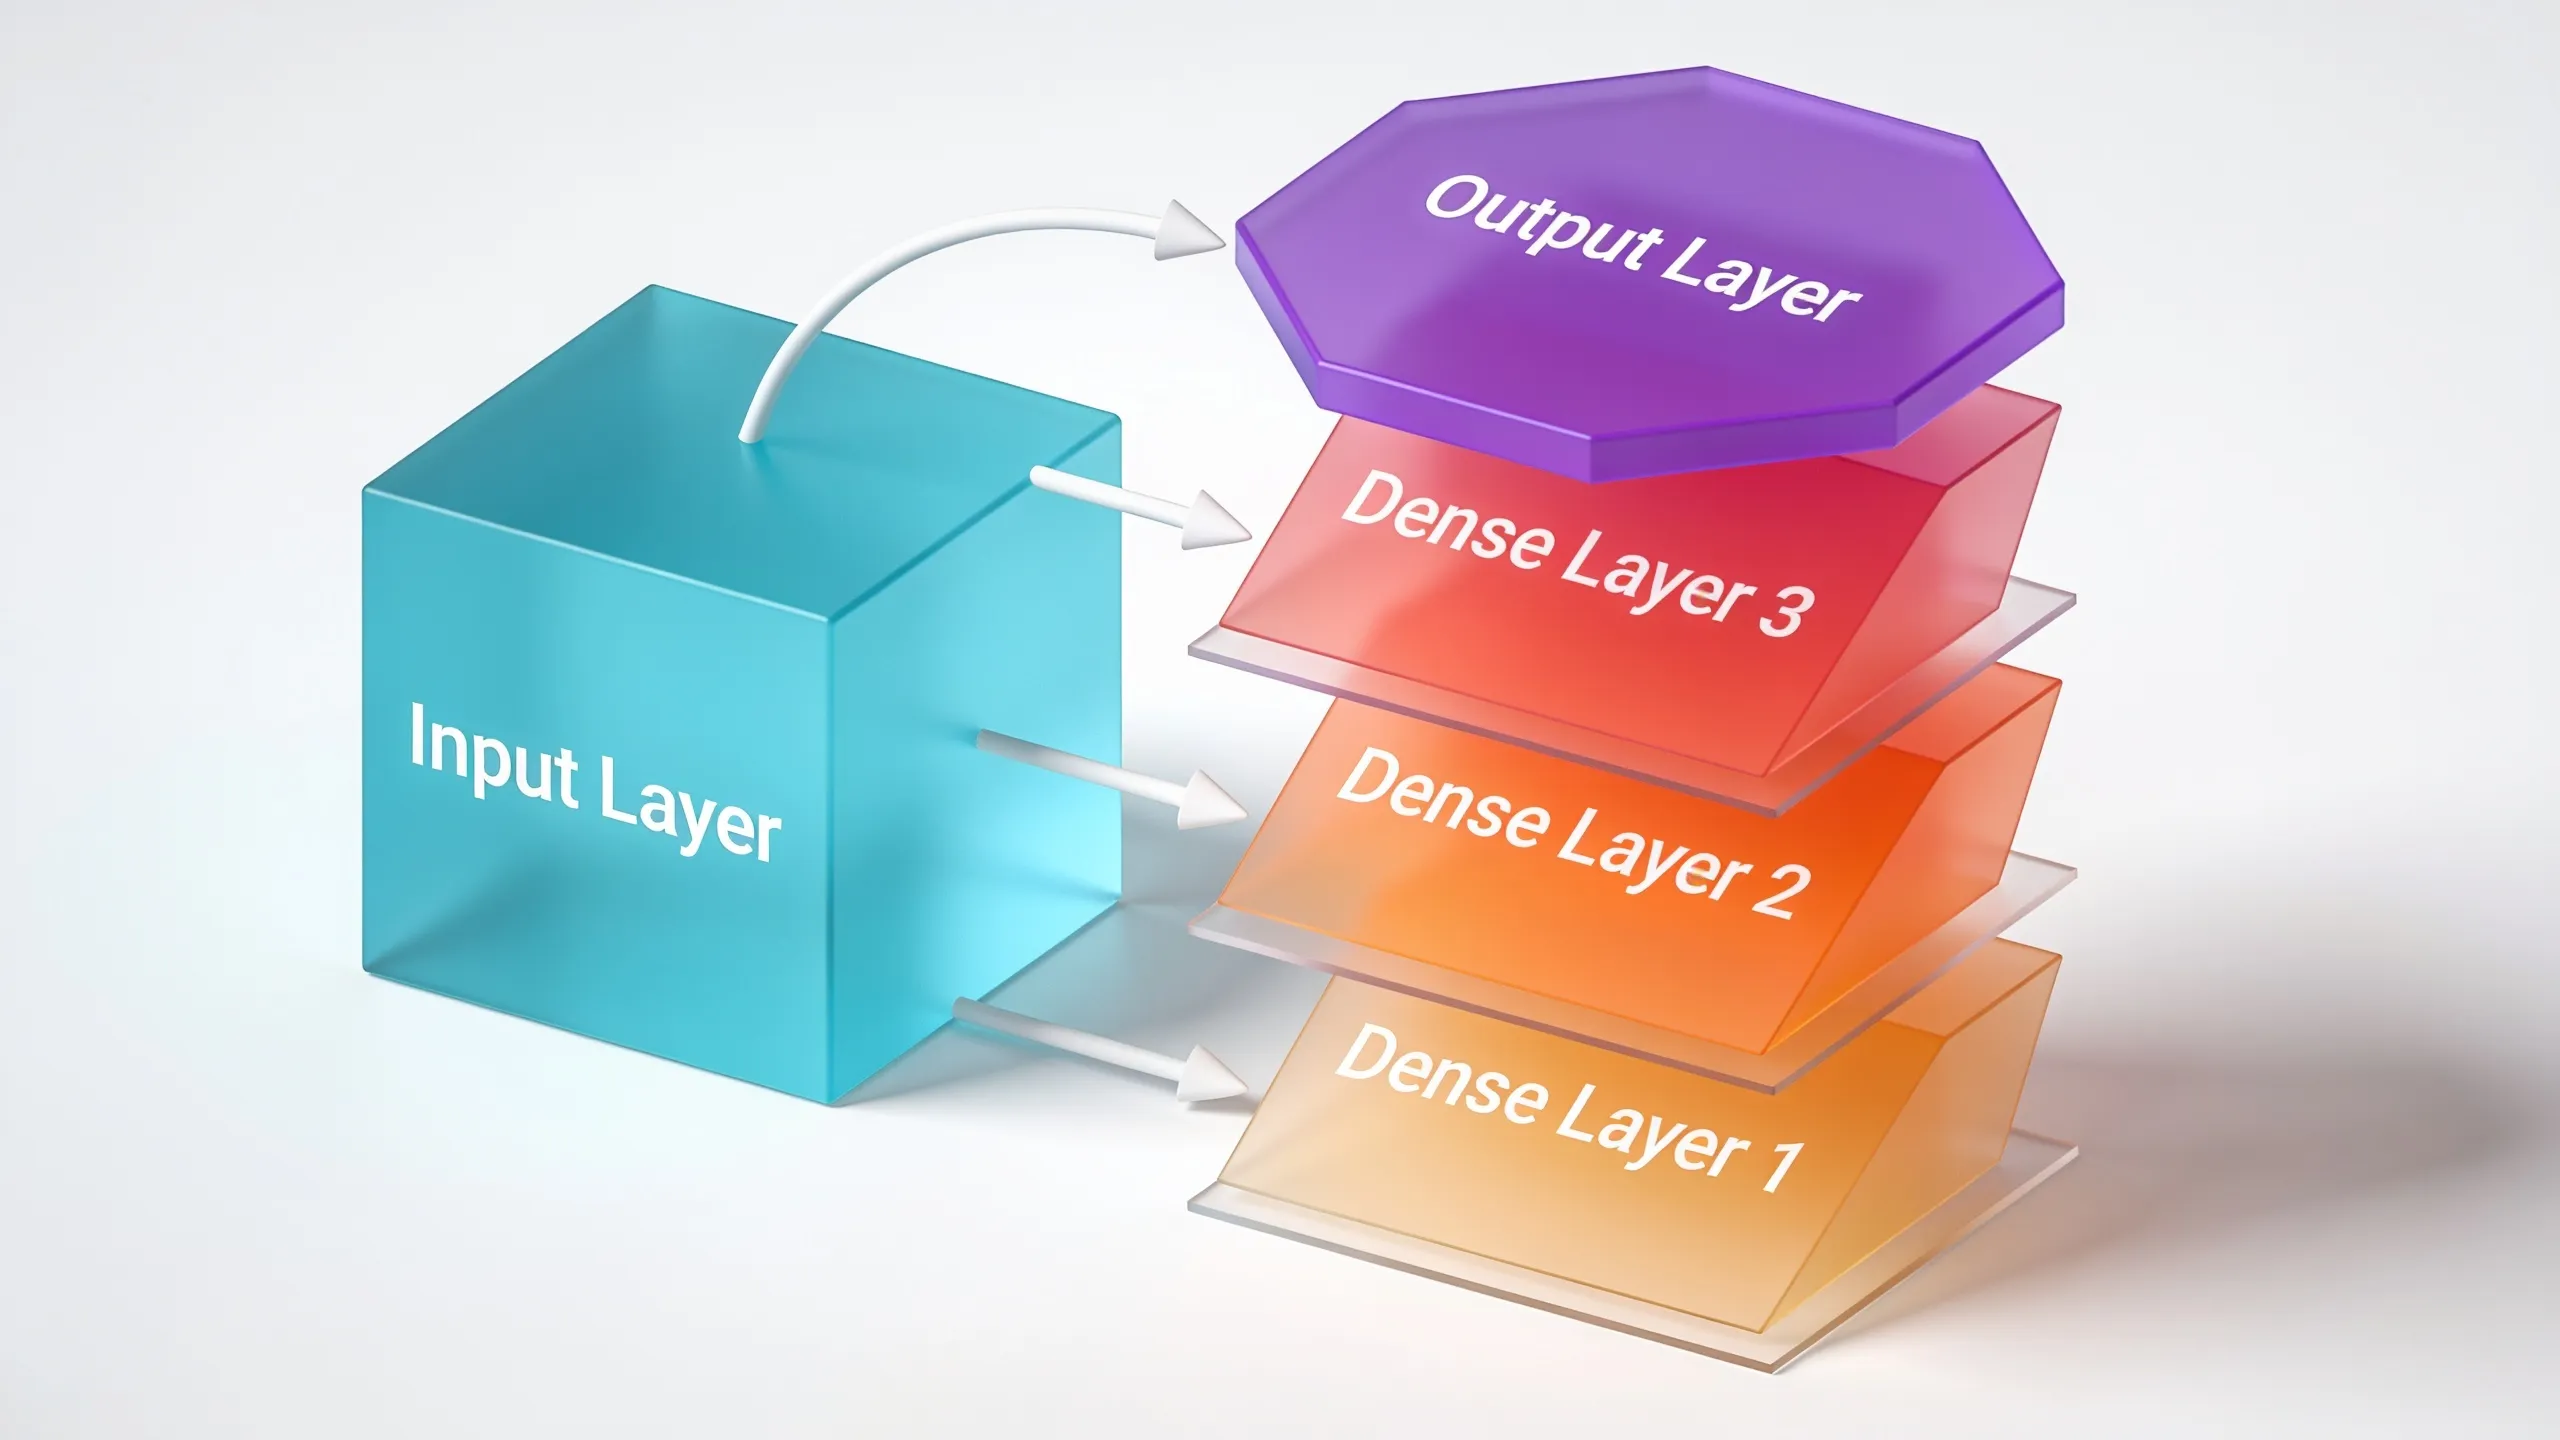
Keras provides a high-level interface for building and training deep learning models, making it essential to understand the structure of a Keras model. At its core, a Keras model is composed of layers, each representing a transformation of the input data. The simplest way to define a model is by using the Sequential API, which allows you to stack layers linearly.
from keras.models import Sequential
from keras.layers import Dense

model = Sequential()
model.add(Dense(64, activation='relu', input_shape=(32,)))
model.add(Dense(10, activation='softmax'))
In this example, we’ve created a Sequential model with two layers. The first layer is a Dense layer with 64 units and ReLU activation function, which takes input data of shape (32,). The second layer is also a Dense layer with 10 units, typically used for output in classification tasks.
Understanding the architecture of your model very important for debugging and optimization. You can visualize the model summary by calling the summary() method, which gives you a detailed overview of each layer, including the output shape and the number of parameters.
model.summary()
This summary helps identify potential issues, such as incompatible shapes or an excessive number of parameters, which may lead to overfitting. Additionally, Keras allows you to define models using the Functional API, which is more flexible and suitable for creating complex architectures such as multi-input or multi-output models.
from keras.layers import Input

inputs = Input(shape=(32,))
x = Dense(64, activation='relu')(inputs)
outputs = Dense(10, activation='softmax')(x)
model = Model(inputs=inputs, outputs=outputs)
The Functional API provides a more detailed approach to model building. Here, we explicitly define the inputs and outputs, allowing for greater flexibility in connecting layers. That’s particularly useful when implementing models with shared layers or complex branching.
Visualizing the model structure is also important for understanding how the data flows through the layers. Keras provides the ability to plot the model architecture using libraries such as Graphviz. To use this feature, you need to install the pydot and graphviz libraries.
from keras.utils import plot_model

plot_model(model, to_file='model.png', show_shapes=True)
This will generate a visual representation of your model, including the shapes of the inputs and outputs for each layer. Such visualizations can greatly enhance your understanding of the model’s architecture, making it easier to communicate your design to others or to debug issues that may arise during training.

Google Play gift code | Give the gift of games, apps and more (Email or Text Message Delivery - US Only)
$25.00 (as of September 24, 2026 17:04 GMT +00:00 - More infoProduct prices and availability are accurate as of the date/time indicated and are subject to change. Any price and availability information displayed on [relevant Amazon Site(s), as applicable] at the time of purchase will apply to the purchase of this product.)Exploring visualization techniques
Another useful technique for visualizing the performance of your model during training is to use TensorBoard, a powerful tool provided by TensorFlow. It allows you to monitor various metrics and visualize the training process, including loss and accuracy curves, histograms of weights, and more. To use TensorBoard, you need to create a callback that logs the training process.
from keras.callbacks import TensorBoard

tensorboard = TensorBoard(log_dir='./logs')
model.fit(x_train, y_train, epochs=10, callbacks=[tensorboard])
After training the model, you can start TensorBoard from the command line by pointing it to the log directory. This will open a web interface where you can explore the metrics visually.
tensorboard --logdir=./logs
In addition to monitoring training, TensorBoard can also help visualize embeddings. If your model includes embedding layers, you can use the Embedding Projector to explore high-dimensional data in a lower-dimensional space. That is particularly useful for understanding how your model represents different classes and how they relate to each other.
Furthermore, when interpreting architectural diagrams, it is essential to consider the flow of data through the model. Each layer transforms the input data, and understanding how these transformations occur can provide insights into the model’s learning capabilities. For instance, convolutional layers are often used in image processing tasks, where they apply filters to detect features, while recurrent layers are essential for sequence data.
from keras.layers import Conv2D, MaxPooling2D, Flatten

model = Sequential()
model.add(Conv2D(32, kernel_size=(3, 3), activation='relu', input_shape=(64, 64, 3)))
model.add(MaxPooling2D(pool_size=(2, 2)))
model.add(Flatten())
model.add(Dense(10, activation='softmax'))
This convolutional model illustrates how an image is processed through convolutional and pooling layers before being flattened and passed to a Dense layer for classification. Each layer’s parameters and the resulting output shapes can be visualized using the summary method or by plotting the model.
Visualizing the model’s architecture not only aids in debugging but also enhances communication among team members, especially in collaborative projects. When discussing model choices, having a clear diagram to refer to can clarify design decisions and the rationale behind certain configurations.
As you delve deeper into more complex models, such as those involving residual connections or attention mechanisms, the importance of clear visual representations becomes even more pronounced. These advanced architectures can be challenging to interpret without thoughtful diagrams that explicitly show how information is processed and transformed at each stage. Tools like Keras and TensorBoard facilitate this process, allowing developers to focus on building robust models.
Interpreting architectural diagrams
When interpreting architectural diagrams, it is important to recognize the significance of each layer and how they interact. For example, attention mechanisms, which have gained popularity in natural language processing and computer vision, allow models to focus on specific parts of the input data. Understanding how these mechanisms are integrated into the architecture can enhance both performance and interpretability.
from keras.layers import Attention

query = Input(shape=(None, 64))
value = Input(shape=(None, 64))
attention_output = Attention()([query, value])
model = Model(inputs=[query, value], outputs=attention_output)
This code snippet demonstrates how to incorporate an attention layer within a Keras model. The attention layer computes a weighted sum of the input values based on the similarity to the query, allowing the model to emphasize relevant information. Architectural diagrams should clearly depict these relationships and the flow of data through the attention mechanism.
Moreover, residual connections, commonly used in deep networks, enable gradients to flow more easily during backpropagation. That’s particularly beneficial in very deep networks, where vanishing gradients can hinder learning. Architectural diagrams should highlight these connections to show how they facilitate training.
from keras.layers import Add

input_tensor = Input(shape=(32,))
x = Dense(64, activation='relu')(input_tensor)
x = Dense(64, activation='relu')(x)
output_tensor = Add()([x, input_tensor])  # Residual connection
model = Model(inputs=input_tensor, outputs=output_tensor)
The above example shows how to implement a residual connection in Keras. The Add layer combines the input tensor with the output of the dense layers, allowing the model to learn an identity function if needed. This architectural choice can be depicted in diagrams to emphasize the model’s ability to learn complex mappings while maintaining stability during training.
As you analyze architectural diagrams, pay attention to the dimensions of the tensors flowing through each layer. Understanding the shape transformations is vital for ensuring compatibility between layers and for optimizing the model’s performance. Keras provides tools to inspect the shape of each layer’s output, which can be particularly useful when debugging complex architectures.
print(model.output_shape)
The output shape of the model can provide insights into how data is transformed at each stage. When combined with visualizations, this information can clarify how the model is expected to behave with various input data. Architectural diagrams should not only represent the layers but also annotate the expected input and output shapes to enhance understanding.
In summary, a well-constructed architectural diagram serves as a roadmap for both the developer and any collaborators. It should encapsulate the model’s flow, the purpose of each layer, and how they collectively contribute to the learning process. By maintaining clarity and detail in these diagrams, you can ensure that the model’s design is both effective and interpretable.
As deep learning continues to evolve, the complexity of models will likely increase. Keeping architectural diagrams simpler yet informative will become increasingly important. This practice not only aids in individual understanding but also fosters collaboration and knowledge sharing within teams.