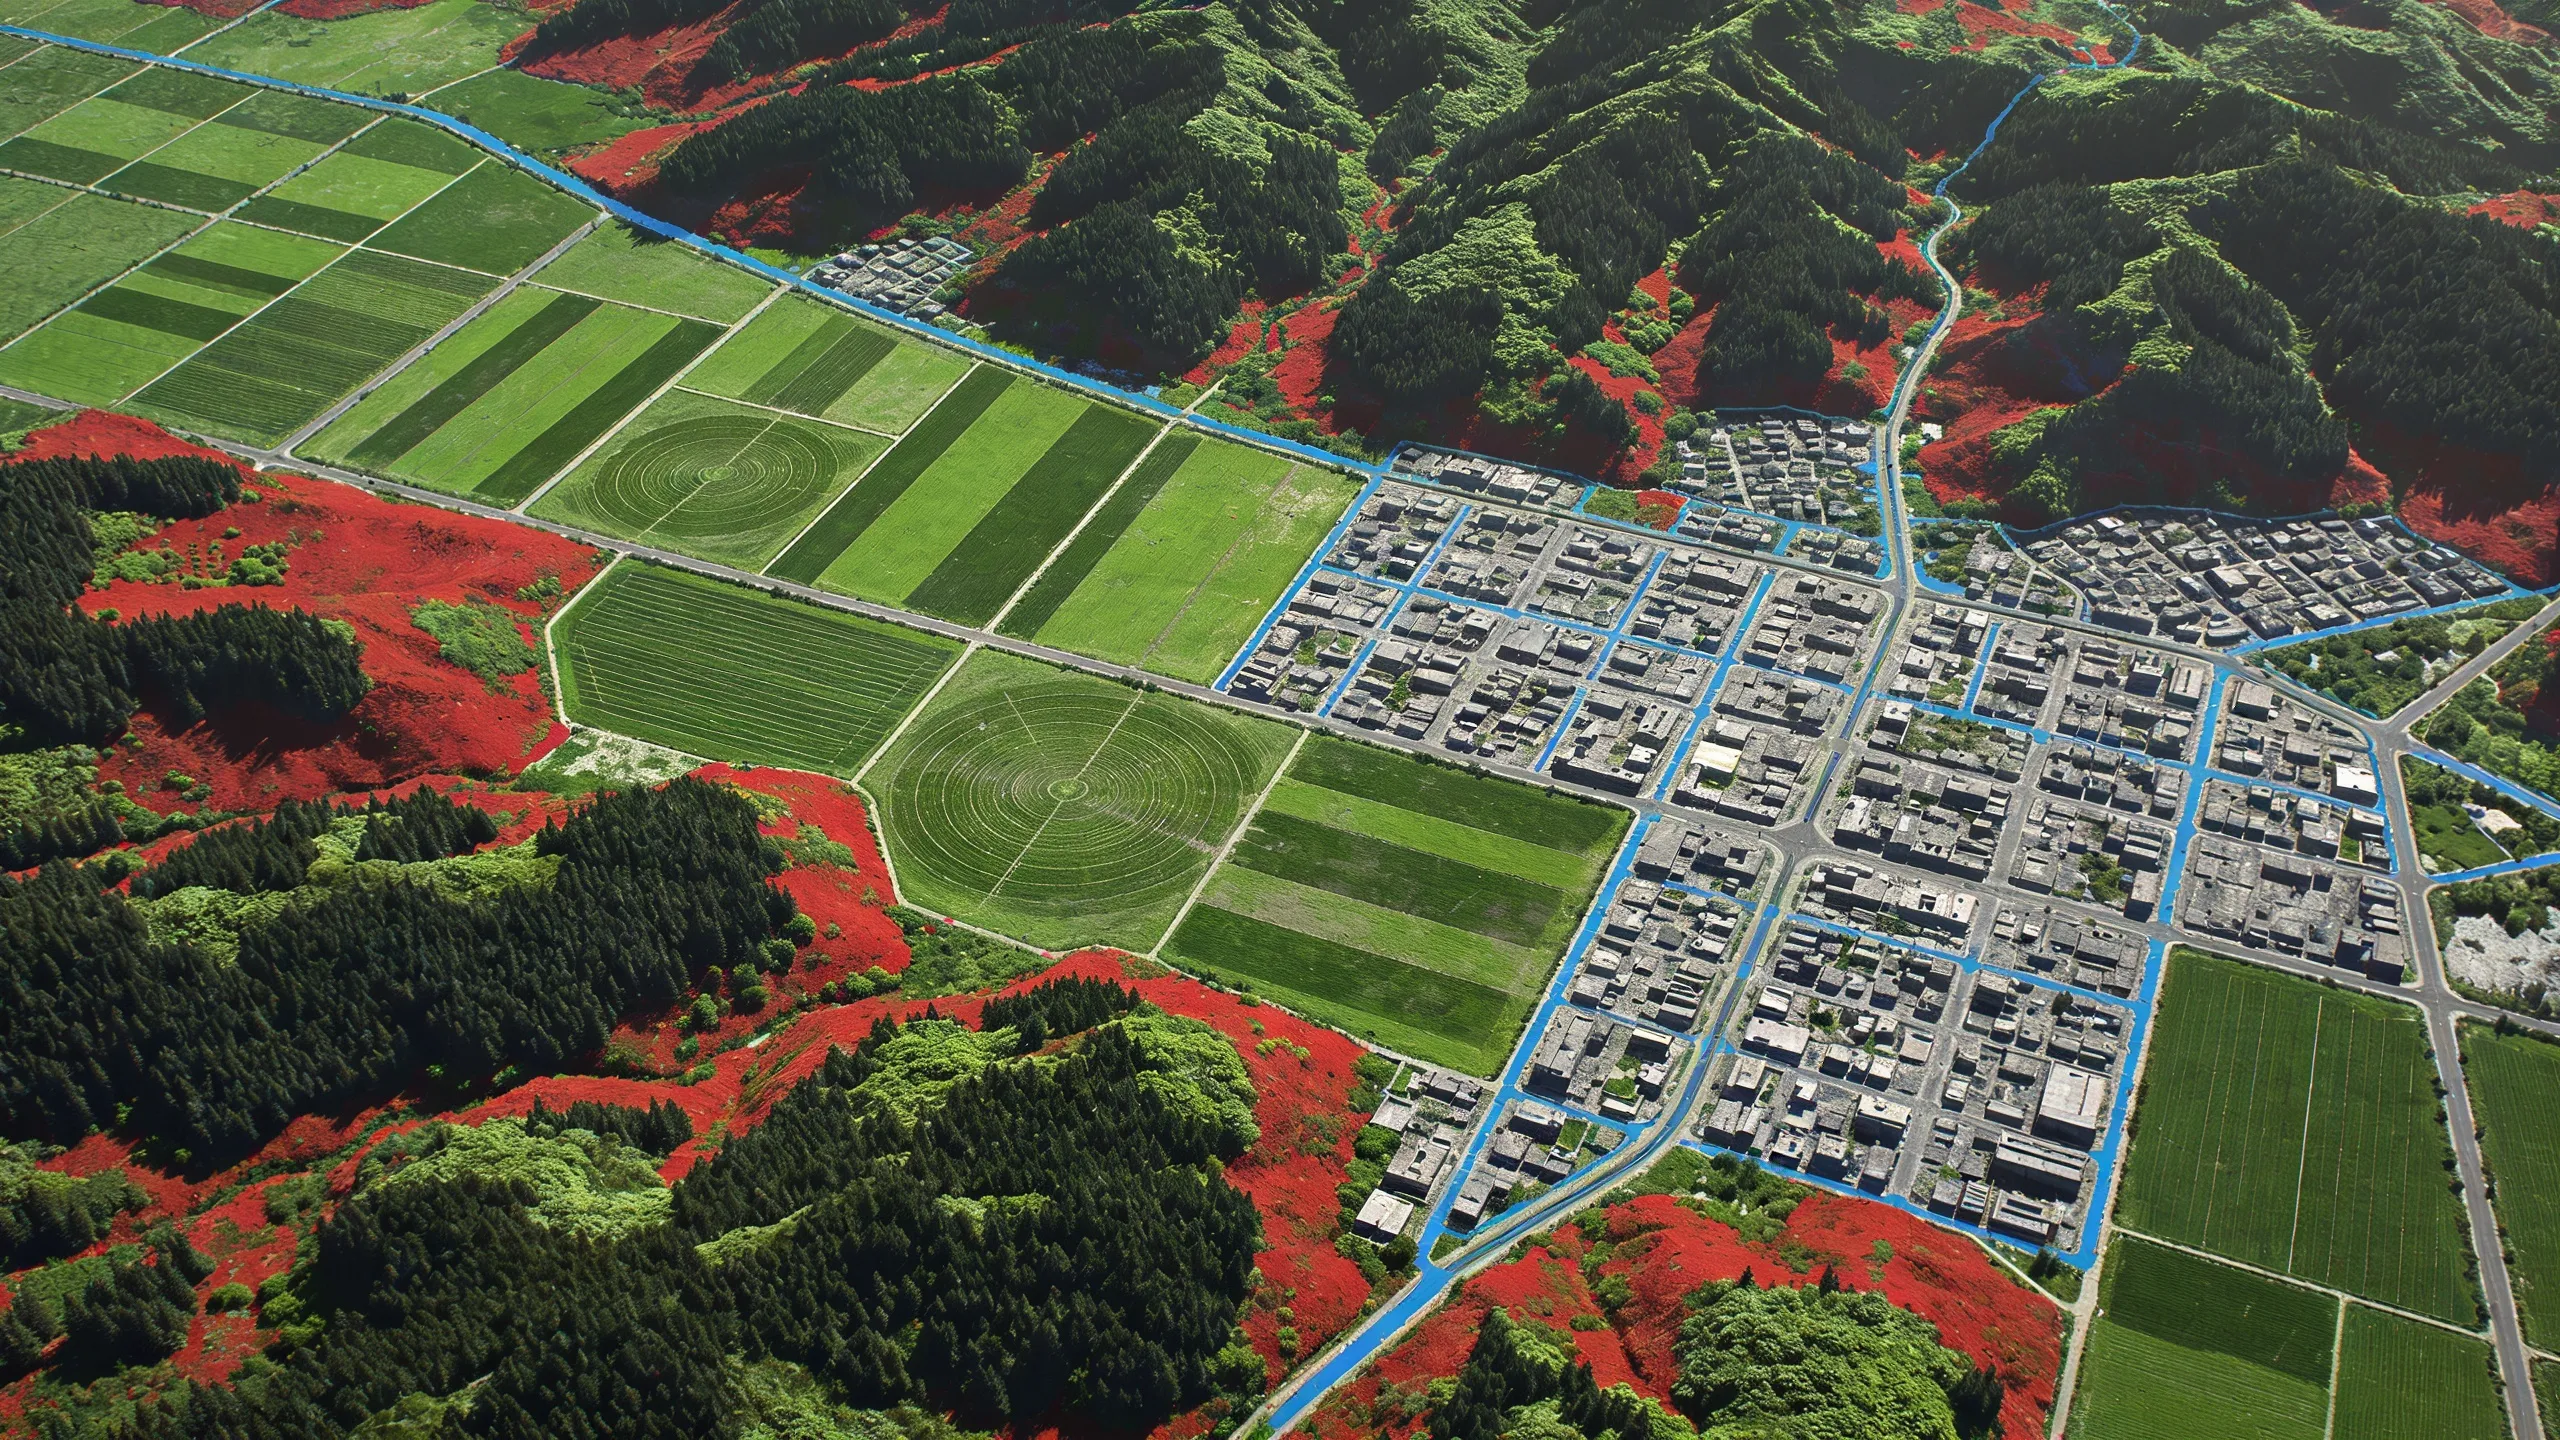
Multiband images are a fascinating subject in the context of digital imaging, particularly when considering how they capture a wider spectrum of data compared to traditional grayscale or RGB images. These images typically consist of multiple layers or bands, each representing different data channels, such as infrared, ultraviolet, or various wavelengths of light.
Understanding the nature of these images begins with grasping how they differ fundamentally from standard images. While an RGB image contains three channels corresponding to red, green, and blue, a multiband image can contain many more. For instance, satellite imagery often captures data across several spectral bands, which can be crucial for various applications like environmental monitoring, agriculture, and urban planning.
To delve into multiband images programmatically, Python provides several libraries, with the most notable being Pillow. This library allows for the manipulation of images with ease, providing methods to access and modify each band individually. Here’s a simple example of how to create a multiband image using Pillow:
from PIL import Image

# Creating a new multiband image
band1 = Image.new('L', (256, 256), color=255)  # White band
band2 = Image.new('L', (256, 256), color=128)  # Gray band
band3 = Image.new('L', (256, 256), color=0)    # Black band

# Combine bands into a multiband image
multiband_image = Image.merge('RGB', (band1, band2, band3))
multiband_image.save('multiband_image.png')
In this snippet, three different grayscale bands are created and then merged into a single RGB image. Each band can be thought of as a layer of information, with the potential to add more bands as needed for more complex data capture.
When working with multiband images, it is essential to consider the data type of each band. The most common formats are usually either floating-point or integer values, depending on the source of the image data and the intended processing. For instance, spectral data from satellites might be stored in floating-point format to preserve precision.
To handle these data types correctly, one might use the NumPy library alongside Pillow, allowing for more advanced manipulations such as array operations for each band:
import numpy as np

# Convert the image to a NumPy array for manipulation
image_array = np.array(multiband_image)

# Perform operations on the bands
image_array[:, :, 0] = image_array[:, :, 0] * 0.5  # Dim the red channel
image_array[:, :, 1] = np.clip(image_array[:, :, 1] + 50, 0, 255)  # Brighten the green channel
With NumPy, you can perform element-wise operations efficiently, which is particularly useful when dealing with large multiband images. The flexibility to manipulate each band independently opens up numerous possibilities for image analysis and processing.
As we explore further into manipulating these images, it becomes clear that the potential applications are vast. From enhancing the visual quality of images to performing complex analyses based on the data contained within each band, the possibilities are limited only by your imagination and the computational resources at your disposal.
Each layer of data contained within a multiband image can be leveraged for specific applications, such as identifying vegetation health using infrared bands or detecting urban development through changes in spectral signatures. Understanding how to access and manipulate this data is important for anyone looking to work in fields such as remote sensing or digital image processing.
When you start to experiment with these techniques, you’ll find that the ability to extract meaningful insights from multiband images relies heavily on your understanding of the underlying data structures and how they interact with the algorithms you plan to employ. This foundational knowledge will serve you well as you navigate the complexities of multilayered image data.

Amazon Physical Gift Card | Mini Envelope - Thank You
$50.00 (as of October 15, 2026 00:39 GMT +00:00 - More infoProduct prices and availability are accurate as of the date/time indicated and are subject to change. Any price and availability information displayed on [relevant Amazon Site(s), as applicable] at the time of purchase will apply to the purchase of this product.)Manipulating multiband images with Pillow
One of the powerful features of Pillow is its ability to perform transformations on individual bands, enabling users to enhance or modify specific aspects of a multiband image. Here’s an example of how to apply a filter to improve the contrast of a specific band:
from PIL import ImageFilter

# Applying a filter to the green band
enhanced_band = band2.filter(ImageFilter.CONTOUR)
multiband_image_with_filter = Image.merge('RGB', (band1, enhanced_band, band3))
multiband_image_with_filter.save('enhanced_multiband_image.png')
In this case, the contour filter accentuates the edges in the green band, which can be particularly useful for applications like edge detection in satellite imagery. The ability to apply different filters to different bands allows for a tailored approach to image processing.
Moreover, Pillow supports various image formats, which means you can easily load multiband images from different sources, including TIFF files commonly used in remote sensing. Here’s how to load a TIFF image and access its bands:
# Load a multiband TIFF image
tiff_image = Image.open('multiband_image.tiff')

# Access individual bands
band1 = tiff_image.getband(1)  # First band
band2 = tiff_image.getband(2)  # Second band
Accessing bands in a TIFF image using Pillow is simpler, and once you have the individual bands, you can manipulate them just as you would with newly created bands. This flexibility is essential when working with existing datasets that may contain valuable information.
As you continue to manipulate multiband images, consider the implications of combining data from various bands. For example, normalizing the data across bands can enhance the overall quality of the image and provide a clearer representation of the underlying information. Here’s an example of normalizing a band:
# Normalizing the second band
max_value = np.max(image_array[:, :, 1])
min_value = np.min(image_array[:, :, 1])
normalized_band = (image_array[:, :, 1] - min_value) / (max_value - min_value) * 255
image_array[:, :, 1] = normalized_band
This snippet normalizes the values in the second band to a range between 0 and 255, which is a common practice in image processing to enhance contrast and visibility. Normalization helps in preparing the data for further analysis or visualization.
As you gain proficiency in manipulating multiband images, consider exploring more advanced techniques such as band arithmetic, where you can perform operations between bands to extract new information. For instance, calculating the normalized difference vegetation index (NDVI) is a common application in remote sensing:
# Calculate NDVI using the near-infrared and red bands
ndvi = (image_array[:, :, 0] - image_array[:, :, 2]) / (image_array[:, :, 0] + image_array[:, :, 2])
In this calculation, the NDVI provides insights into vegetation health by analyzing the reflectance in near-infrared and red bands. Such indices are invaluable in agricultural monitoring and environmental studies.
As you implement these techniques, keep in mind the importance of understanding the context and characteristics of the data you’re working with. Each band may represent different phenomena, and knowing how to interpret these can lead to more effective analyses and results. As you continue to experiment with Pillow and NumPy, the insights you gain will inform your approach to tackling increasingly complex image processing tasks.
Ultimately, the depth of your manipulation capabilities will depend on your understanding of both the tools at your disposal and the data structures you’re working with. This knowledge will empower you to extract meaningful insights from multiband images and apply them in practical scenarios across various fields.
Exploring multilayered image techniques
Practical applications of multilayered images extend beyond mere visualization; they’re integral to various fields such as environmental science, agriculture, and urban planning. By using the unique data captured in each band, professionals can derive insights that are not possible with standard imaging techniques.
For instance, in agriculture, remote sensing techniques use multiband images to monitor crop health. By analyzing the reflectance in specific spectral bands, farmers can determine areas of stress or disease in their fields. Here’s how you can compute a simple vegetation index using Python:
# Calculate the Simple Vegetation Index (SVI)
svi = (image_array[:, :, 0] - image_array[:, :, 1]) / (image_array[:, :, 0] + image_array[:, :, 1])
This index helps in identifying healthy vegetation, as healthy plants reflect more near-infrared light compared to visible light. Such analyses can guide irrigation practices and pest control measures, ultimately enhancing yield.
Urban planning also benefits from the analysis of multiband images. By examining changes in land use through time-series analysis of satellite images, planners can make informed decisions about zoning and infrastructure development. Here’s how you might visualize changes over time by comparing two multiband images:
# Load two multiband images for comparison
image1 = Image.open('multiband_image1.tiff')
image2 = Image.open('multiband_image2.tiff')

# Convert to NumPy arrays for analysis
array1 = np.array(image1)
array2 = np.array(image2)

# Calculate the difference between the two images
difference = np.abs(array1 - array2)
This difference image can reveal significant changes in land cover, such as deforestation, urban sprawl, or changes in water bodies. Visualizing these differences can help stakeholders understand the impact of development over time.
Furthermore, in the field of climate science, multilayered images are essential for monitoring environmental changes. By analyzing data from different spectral bands, scientists can assess factors such as temperature variations, moisture levels, and atmospheric conditions. For example, combining thermal bands with visible bands can provide a comprehensive view of land surface temperatures:
# Combine thermal and visible bands for temperature analysis
thermal_band = Image.open('thermal_band.tiff')
visible_band = Image.open('visible_band.tiff')

# Convert to arrays and analyze
thermal_array = np.array(thermal_band)
visible_array = np.array(visible_band)

# Simple analysis of temperature distribution
temperature_distribution = thermal_array / visible_array
This calculation can yield insights into heat islands and assist in urban heat management strategies. The ability to overlay and analyze different data types makes multilayered images a powerful tool for scientists and planners alike.
As we continue to explore the versatility of multilayered images, consider the role of machine learning in enhancing image analysis. By training models on labeled datasets, you can automate the process of feature extraction from multiband images, paving the way for advanced applications such as land cover classification or object detection.
Integrating machine learning with image processing can drastically improve efficiency and accuracy. For instance, using libraries like TensorFlow or PyTorch alongside Pillow can facilitate the development of sophisticated models that learn to identify patterns in the image data:
import tensorflow as tf

# Assuming 'training_data' contains your multiband images and 'labels' are the corresponding classes
model = tf.keras.Sequential([
    tf.keras.layers.Flatten(input_shape=(height, width, bands)),
    tf.keras.layers.Dense(128, activation='relu'),
    tf.keras.layers.Dense(num_classes, activation='softmax')
])

model.compile(optimizer='adam', loss='sparse_categorical_crossentropy', metrics=['accuracy'])
model.fit(training_data, labels, epochs=10)
This snippet demonstrates a simple neural network structure for classifying multilayered images. The ability to train on diverse datasets can lead to powerful predictive models that enhance decision-making processes across sectors.
As you delve deeper into the realm of multilayered images, the intersection of data science and imaging technology will only expand the horizons of what is possible, allowing for more nuanced analyses and applications. Engaging with these techniques will prepare you for the evolving challenges in image processing and analysis.
Practical applications and examples of multilayered images
Practical applications of multilayered images extend beyond mere visualization; they are integral to various fields such as environmental science, agriculture, and urban planning. By using the unique data captured in each band, professionals can derive insights that are not possible with standard imaging techniques.
For instance, in agriculture, remote sensing techniques use multiband images to monitor crop health. By analyzing the reflectance in specific spectral bands, farmers can determine areas of stress or disease in their fields. Here’s how you can compute a simple vegetation index using Python:
# Calculate the Simple Vegetation Index (SVI)
svi = (image_array[:, :, 0] - image_array[:, :, 1]) / (image_array[:, :, 0] + image_array[:, :, 1])
This index helps in identifying healthy vegetation, as healthy plants reflect more near-infrared light compared to visible light. Such analyses can guide irrigation practices and pest control measures, ultimately enhancing yield.
Urban planning also benefits from the analysis of multiband images. By examining changes in land use through time-series analysis of satellite images, planners can make informed decisions about zoning and infrastructure development. Here’s how you might visualize changes over time by comparing two multiband images:
# Load two multiband images for comparison
image1 = Image.open('multiband_image1.tiff')
image2 = Image.open('multiband_image2.tiff')

# Convert to NumPy arrays for analysis
array1 = np.array(image1)
array2 = np.array(image2)

# Calculate the difference between the two images
difference = np.abs(array1 - array2)
This difference image can reveal significant changes in land cover, such as deforestation, urban sprawl, or changes in water bodies. Visualizing these differences can help stakeholders understand the impact of development over time.
Furthermore, in the field of climate science, multilayered images are essential for monitoring environmental changes. By analyzing data from different spectral bands, scientists can assess factors such as temperature variations, moisture levels, and atmospheric conditions. For example, combining thermal bands with visible bands can provide a comprehensive view of land surface temperatures:
# Combine thermal and visible bands for temperature analysis
thermal_band = Image.open('thermal_band.tiff')
visible_band = Image.open('visible_band.tiff')

# Convert to arrays and analyze
thermal_array = np.array(thermal_band)
visible_array = np.array(visible_band)

# Simple analysis of temperature distribution
temperature_distribution = thermal_array / visible_array
This calculation can yield insights into heat islands and assist in urban heat management strategies. The ability to overlay and analyze different data types makes multilayered images a powerful tool for scientists and planners alike.
As we continue to explore the versatility of multilayered images, consider the role of machine learning in enhancing image analysis. By training models on labeled datasets, you can automate the process of feature extraction from multiband images, paving the way for advanced applications such as land cover classification or object detection.
Integrating machine learning with image processing can drastically improve efficiency and accuracy. For instance, using libraries like TensorFlow or PyTorch alongside Pillow can facilitate the development of sophisticated models that learn to identify patterns in the image data:
import tensorflow as tf

# Assuming 'training_data' contains your multiband images and 'labels' are the corresponding classes
model = tf.keras.Sequential([
    tf.keras.layers.Flatten(input_shape=(height, width, bands)),
    tf.keras.layers.Dense(128, activation='relu'),
    tf.keras.layers.Dense(num_classes, activation='softmax')
])

model.compile(optimizer='adam', loss='sparse_categorical_crossentropy', metrics=['accuracy'])
model.fit(training_data, labels, epochs=10)
This snippet demonstrates a simple neural network structure for classifying multilayered images. The ability to train on diverse datasets can lead to powerful predictive models that enhance decision-making processes across sectors.
As you delve deeper into the realm of multilayered images, the intersection of data science and imaging technology will only expand the horizons of what is possible, allowing for more nuanced analyses and applications. Engaging with these techniques will prepare you for the evolving challenges in image processing and analysis.